Container Security Monitoring with Prometheus and Grafana
Today, millions of applications are running in containers, with many millions more going into production. It is not easy to manage and monitor a massive number of containers in any deployment at the same time. In order to better visualize and track container status, the combination of Prometheus and Grafana provides a simple, easy-to-deploy solution. By integrating these open-source tools with the NeuVector container security platform, critical security information can be monitored centrally.
About Prometheus
Prometheus is an open-source application monitoring and alerting software solution. It is a web application which can be deployed anywhere – in a PC, virtual machine, or even in a container. It scrapes data from the exporters (small programs convert system data to Prometheus metrics) periodically and records the real-time metrics in a time series database.
About Grafana
Grafana is an open-source metric analytics & visualization application. It is used for visualizing time series data for infrastructure and application analytics.
It is also a web application which can be deployed anywhere that users want. It can target a data source from Prometheus and use its customizable panels to give users powerful visualization of the data from any infrastructure under management.
About the Exporter
An exporter is a piece of software that users can deploy beside the application from which they want to obtain metrics. It gathers the required data from the application and transforms them into the correct format that Prometheus can read. An exporter is just like a small one-to-one proxy, converting data between the metrics interface of an application and the Prometheus exposition format.
Why Prometheus + Grafana?
The relationship between Prometheus and Grafana is like a backend and frontend for a data monitoring system. Prometheus acts as the data collection and storage backend and Grafana as the interface for analysis and visualization.

SAMPLE OFFICIAL PROMETHEUS EXPORTERS
One of the significant advantages of Prometheus is the exporter feature. The official Prometheus website has already provided many useful exporters for users, and the Prometheus communities also have many customized exporters built by users themselves. By using different kinds of the exporters, Prometheus is able to monitor applications in all types of environments. This is especially efficient for docker & Kubernetes container environments.
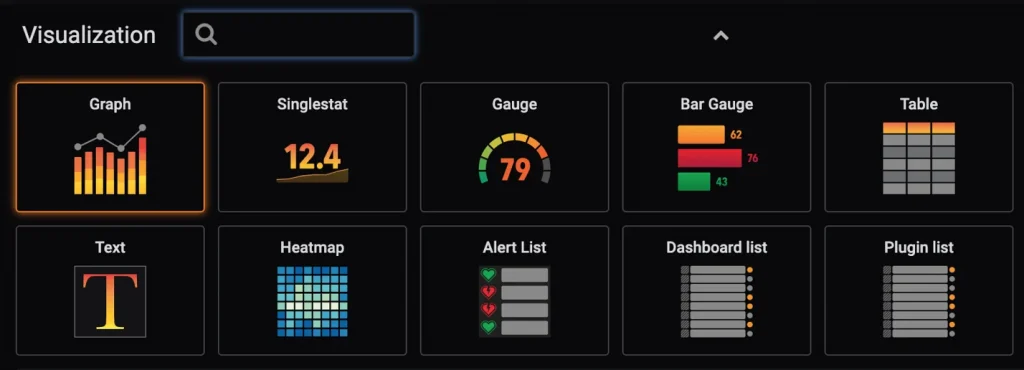
One of the significant advantages of Grafana is its customization features. It’s effortless to customize the visualization for massive amounts of data. Users can choose a linear graph, a single number panel, a gauge, a table, or a heatmap to display their data. They can also sort all their data with various labels; data with different labels will go to different panels. The dashboard can be rearranged and resized simply by dragging panels around. These customization features make Grafana useful and powerful for many different types of users, such as DevOps, Security, Operations, and Networking.
The NeuVector Exporter
Although Prometheus and third-party developers have provided hundreds of great exporters, sometimes one exporter may not contain all the functionality which users want. Users may need to deploy another exporter or more exporters for one monitoring target.
For this reason, we developed our customized exporter for NeuVector customers. The NeuVector exporter is very small, neat, and accurate. Rather than deploying a huge package like other exporters, we use a single python file. It only includes what we want without unneeded metrics or data. It is also customizable by users.
The nv-exporter utilizes the NeuVector Controller REST API. After users deploy the exporter, it sends API requests to the NeuVector Controller. The exporter will receive a response in the JSON format, then parse the JSON file and compile the useful data into Prometheus metrics.
The exporter listens on a port for Prometheus to connect. Prometheus will connect to the port, scrape all the metrics and recode them internally.
Finally, Grafana reads all the metrics in the linked Prometheus target and enables users to visualize them on the dashboard panel.
The NeuVector Grafana Dashboard
To present the best visualization for NeuVector users, we have designed a dashboard template for our users. Users can simply import our dashboard into Grafana using the dashboard JSON file.
One Grafana dashboard can be used to present data of one cluster. Each dashboard contains the following information:
- System summary
– Number of Pods, Hosts, Controllers, Enforcers, and disconnected enforcers
– Admission control status
– Vulnerability database versions and the date it was created - Total network traffic volume inspected by NeuVector
- CPU & Memory Usage of NeuVector enforcers
- The most vulnerable services discovered during run-time
- The most vulnerable images in registries/repositories scanned
- The most recent Security Event Log

Of course, these can be customized and extended if other data is desired to be visualized. Try out the exporter and Grafana template at https://github.com/neuvector/prometheus-exporter and let us know your feedback!
Related Articles
Oct 25th, 2023
What is Container Security?
Feb 01st, 2023